
28 Nov 2022
Grafiek Fidelity: Inflatie VS bereikt piek
Beste redacteur,
Consumentenprijzen bewegen mee met de omvang van de detailhandelsverkopen. Met deze logica in het achterhoofd laat de grafiek van vermogensbeheerder Fidelity International zien dat de inflatiepiek in de VS is bereikt.
De grafiek toont de reële waarden van de detailhandelsverkopen verdisconteerd met de kerninflatie van de consumentenprijzen voor de aankomende 12 maanden. Op basis hiervan suggereert de vertraging van de reële detailhandelsverkopen dat de kerninflatie kan dalen van 6,3% in oktober (de meest recente publicatie) tot ongeveer 2% tegen eind 2023. Dit is een van de indicatoren die erop wijzen dat de inflatie in de VS haar hoogtepunt heeft bereikt. Andere indicatororen hiervoor vormen inkoopmanagersindices (PMI's).
Voor beleggers betekent dit dat obligaties weer aantrekkelijk worden. Een ommekeer van het rentebeleid van de Fed lijkt echter nog ver weg, maar dit hangt af van de mate waarin de inflatie afneemt de komende tijd. Ook hiervoor zullen de Amerikaanse detailhandelsverkopen een indicator zijn.
Hieronder vindt u het volledige bericht:
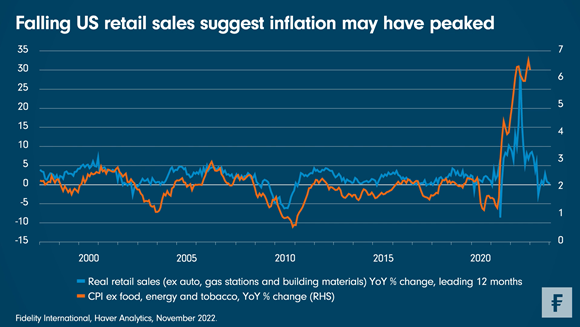
Chart Room: Falling US retail sales suggest inflation may have peaked
Real retail sales, a proxy for overall economic demand, have fallen significantly since 2021. Historically, core inflation tends to follow moves in retail sales, suggesting inflation could be due to ease soon - and has almost certainly peaked.
Where retail sales lead, consumer prices tend to follow. And by that logic, this week’s Chart Room offers one argument that we may have already seen the peak of US inflation.
The chart shows real retail sales values deflated by core consumer price inflation (this measure of core CPI excludes food, energy, and tobacco prices) and pushed forward 12 months to more clearly highlight how this proxy of aggregate economic demand tends to lead price changes.
On this basis, the slowdown in real retail sales since 2021 suggests that core CPI could fall from 6.3 per cent in October (the most recent release) to around 2 per cent by the end of 2023, should the normal lead/lag relationship hold. While we take this literal read across with a pinch of salt, the direction of travel over the short to medium term is clear. Over the longer term, we expect inflation to settle at close to 3 per cent, notably exceeding the Fed’s 2 per cent target level, driven higher by structural factors such as decarbonisation, deglobalisation, and debt.
This is one of several indicators suggesting that inflation in the US has peaked. Other such measures include the price components in surveys like purchasing managers’ indices (PMIs), as well as measures of supply chain stress, like shipping rates from China to the US. All of these indicators now show substantial movement in inflation back to pre-Covid levels. Among the many investment implications, this would certainly be good news for fixed income, and is part of the reason why we think bonds may finally look attractive once again.
Nonetheless, the point at which the US Federal Reserve starts cutting interest rates (the so-called pivot) may yet be some time away. For now, all signs point to a much more nuanced phase of the cycle, with inflation easing but still high. How quickly it recedes will determine when the Fed changes course. For a clue to the timing, keep a close eye on US retail sales.
Notes to editors
Voor meer informatie:
Stampa
fidelity@stampacommunications.com
Thekla van Oijen: +31 20 404 2630
This material is provided to you in your capacity as media agency/journalist. The material serves exclusively as background information. Rewriting of content is under your responsibility unless otherwise agreed.

Powered by Onclusive PR Manager © 2026